Dashboard
The Dashboard is the home page of Metatate and the first screen you see after completing installation and setup. It provides a high-level overview of your governance posture and quick access to common workflows.
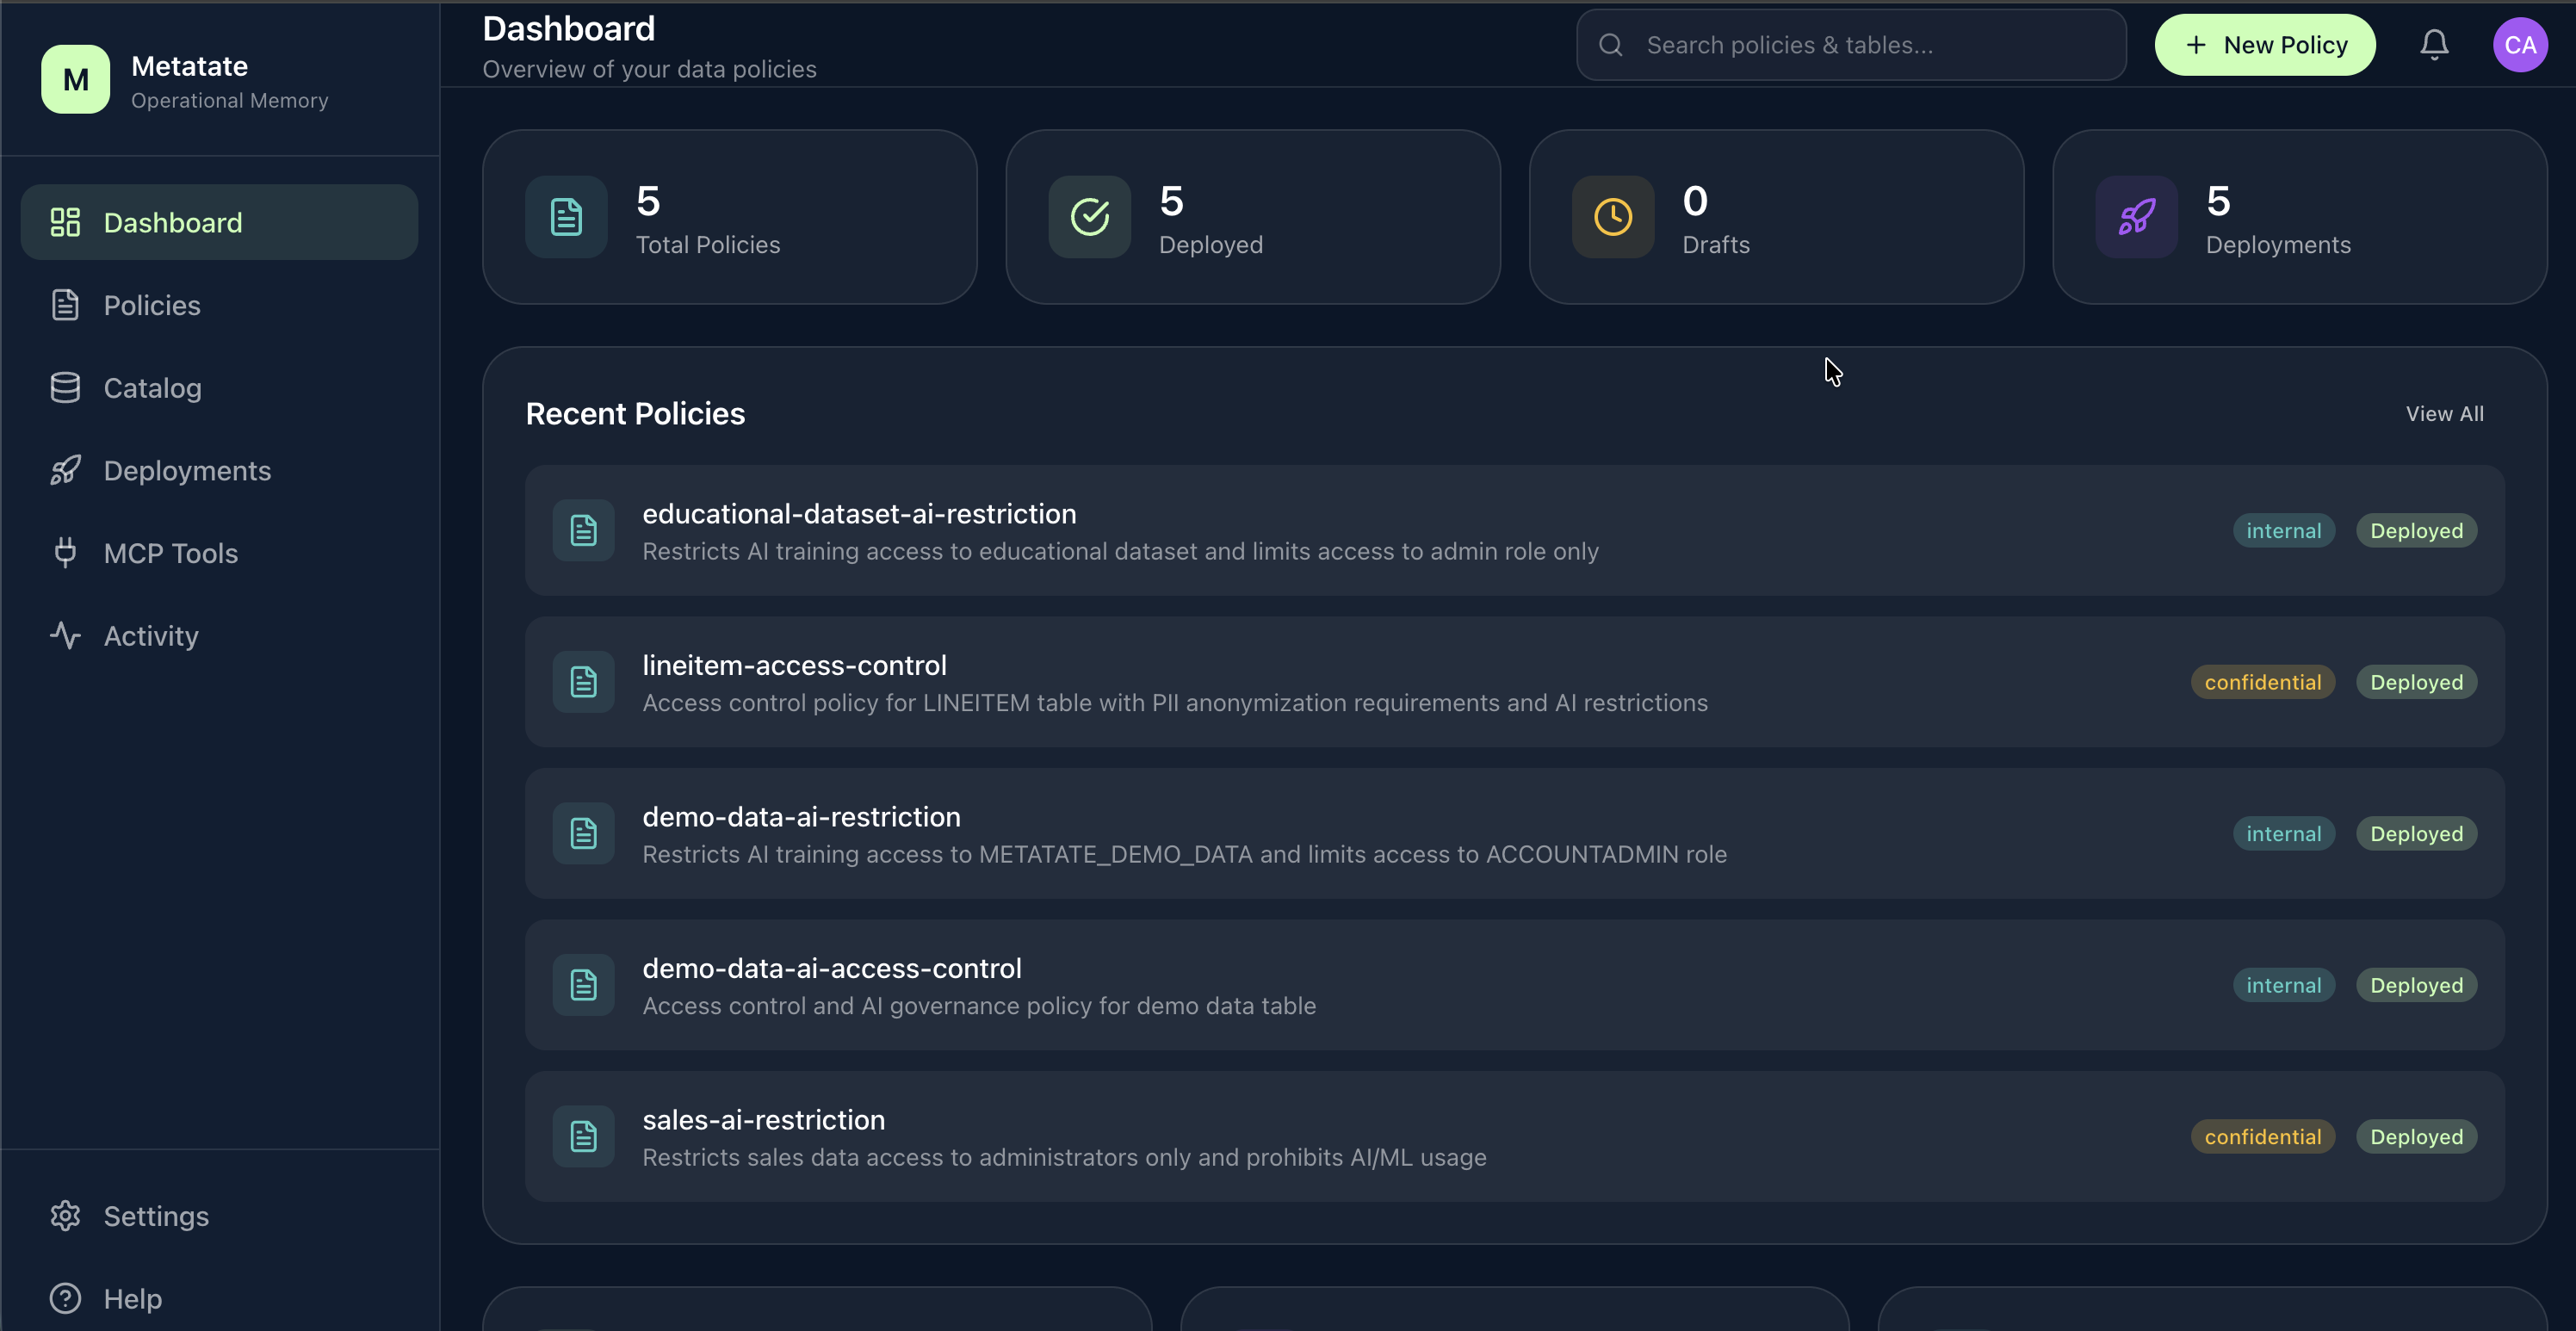
Governance Stats
The top of the dashboard displays key metrics at a glance:
- Total Policies -- The number of policies you have created (draft + deployed).
- Deployed Policies -- How many policies are currently active and materialized.
- Tables Covered -- The count of tables that have at least one deployed policy.
- Columns Classified -- The number of columns that have been classified with a data type.
These counters update automatically after each deployment cycle.
Recent Activity
A feed of the most recent actions taken in the application, pulled from the Activity Log. Each entry shows:
- The action performed (e.g.,
policy.created,deploy.applied) - Who performed it and when
- A link to the relevant entity
This gives teams quick visibility into what has changed without navigating to the full log.
Quick Actions
The dashboard provides shortcut buttons for the most common tasks:
| Action | Description |
|---|---|
| Create Policy | Opens the Policy Editor with a blank policy |
| Browse Catalog | Navigates to the Catalog to explore your tables |
| Deploy Policies | Jumps to the Deployments page |
| Connect MCP | Opens the MCP Tools connection tab |
What's Next
From the dashboard, most users follow one of two paths:
- New to Metatate -- Start by browsing the Catalog to see your tables, then create your first policy.
- Returning users -- Check recent activity, then head to Deployments to apply any pending changes.